Monday 28 September 2015

How To Use Kibana Dashboards and Visualizations

How To Use Kibana Dashboards and Visualizations

How To Use Kibana Dashboards and Visualizations

Mar 12, 2015  Logging

Introduction

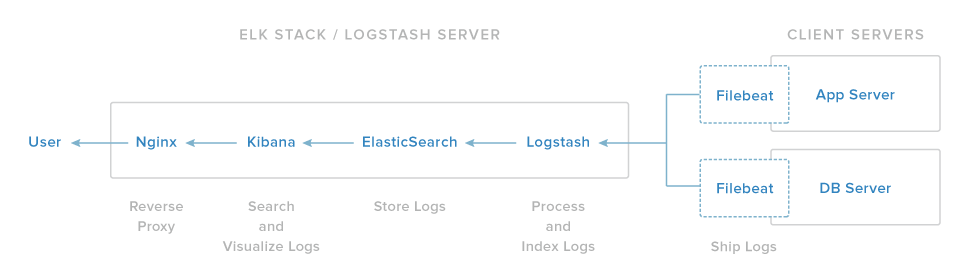
Kibana 4 is an analytics and visualization platform that builds on Elasticsearch to give you a better understanding of your data. In this tutorial, we will get you started with Kibana, by showing you how to use its interface to filter and visualize log messages gathered by an Elasticsearch ELK stack. We will cover the main interface components, and demonstrate how to create searches, visualizations, and dashboards.

Prerequisites

This tutorial is the third part in the Centralized Logging with Logstash and Kibana series.
It assumes that you have a working ELK setup. The examples assume that you are gathering syslog and Nginx access logs. If you are not gathering these types of logs, you should be able to modify the demonstrations to work with your own log messages.
If you want to follow this tutorial exactly as presented, you should have the following setup, by following the first two tutorials in this series:
When you are ready to move on, let's look at an overview of the Kibana interface.

Kibana Interface Overview

The Kibana interface is divided into four main sections:
  • Discover
  • Visualize
  • Dashboard
  • Settings
We will go over the basics of each section, in the listed order, and demonstrate how each piece of the interface can be used.
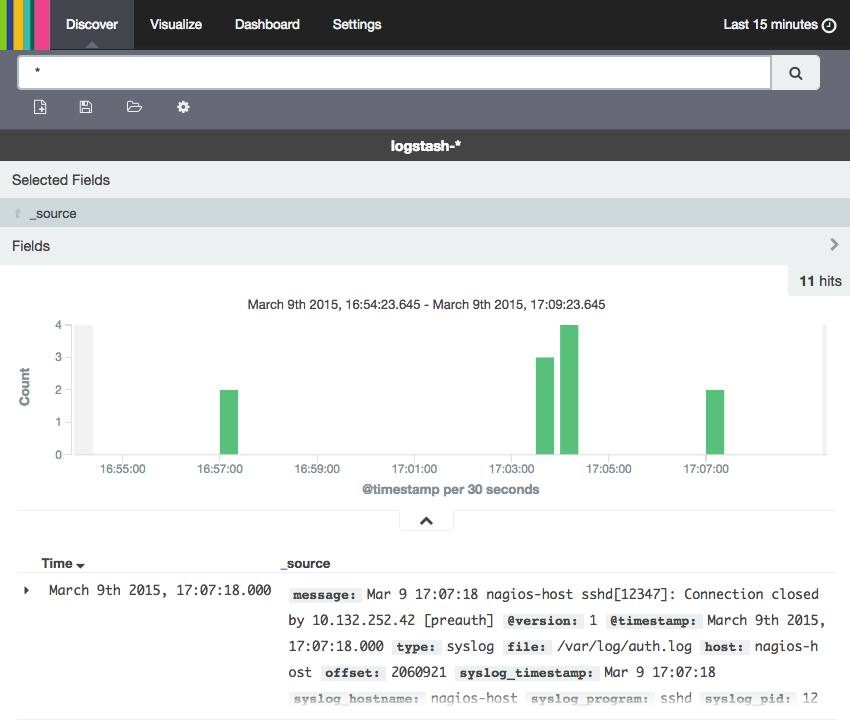
Kibana Discover

When you first connect to Kibana 4, you will be taken to the Discover page. By default, this page will display all of your ELK stack's most recently received logs. Here, you can filter through and find specific log messages based on Search Queries, then narrow the search results to a specific time range with theTime Filter.
Here is a breakdown of the Kibana Discover interface elements:
  • Search Bar: Directly under the main navigation menu. Use this to search specific fields and/or entire messages
  • Time Filter: Top-right (clock icon). Use this to filter logs based on various relative and absolute time ranges
  • Field Selector: Left, under the search bar. Select fields to modify which ones are displayed in theLog View
  • Date Histogram: Bar graph under the search bar. By default, this shows the count of all logs, versus time (x-axis), matched by the search and time filter. You can click on bars, or click-and-drag, to narrow the time filter
  • Log View: Bottom-right. Use this to look at individual log messages, and display log data filtered by fields. If no fields are selected, entire log messages are displayed
This animation demonstrates a few of the main features of the Discover page:
How To Use Kibana Discover
Here is a step-by-step description of what is being performed:
  1. Selected the "type" field, which limits what is displayed for each log record (bottom-right)—by default, the entire log message is displayed
  2. Searched for type: "nginx-access", which only matches Nginx access logs
  3. Expanded the most recent Nginx access log to look at it in more detail
Note that the results are being limited to the "Last 15 minutes". If you are not getting any results, be sure that there were logs, that match your search query, generated in the time period specified.
The log messages that are gathered and filtered are dependent on your Logstash and Logstash Forwarder configurations. In our example, we are gathering the syslog and Nginx access logs, and filtering them by "type". If you are gathering log messages but not filtering the data into distinct fields, querying against them will be more difficult as you will be unable to query specific fields.

Search Syntax

The search provides an easy and powerful way to select a specific subset of log messages. The search syntax is pretty self-explanatory, and allows boolean operators, wildcards, and field filtering. For example, if you want to find Nginx access logs that were generated by Google Chrome users, you can search fortype: "nginx-access" AND agent: "chrome". You could also search by specific hosts or client IP address ranges, or any other data that is contained in your logs.
When you have created a search query that you want to keep, you can do that by clicking the Save Searchicon then the Save button, like in this animation:
How To Save a Kibana Search
Saved searches can be opened at any time by clicking the Load Saved Search icon, and they can also be used when creating visualizations.
We will save the type: "nginx-access" search as "type nginx access", and use it to create a visualization.

Kibana Visualize

The Kibana Visualize page is where you can create, modify, and view your own custom visualizations. There are several different types of visualizations, ranging from Vertical bar and Pie charts to Tile maps(for displaying data on a map) and Data tables. Visualizations can also be shared with other users who have access to your Kibana instance.
If this is your first time using Kibana visualizations, you must reload your field list before proceeding. Instructions to do this are covered in the Reload Field Data subsection, under the Kibana Settings section.

Create Vertical Bar Chart

To create a visualization, first, click the Visualize menu item.
Decide which type of visualization you want, and select it. We will create a Vertical bar chart, which is a good starting point.
Now you must select a search source. You may either create a new search or use a saved search. We will go with the latter method, and select the type nginx access search that we created earlier.
At first, the preview graph, on the right side, will be a solid bar (assuming that your search found log messages) because it consists only of a Y-axis of "Count". That is, it is simply displaying the number of logs that were found with the specified search query.
To make the visualization more useful, let's add some new buckets to it.
First, add an X-axis bucket, then click the Aggregation drop-down menu and select "Date Histogram". If you click the Apply button, the single bar will split into several bars along the X-axis. Now the Count is displayed as multiple bars, divided into intervals of time (which can be modified by selecting an interval from the drop-down)—similar to what you would see on the Discover page.
If we want to make the graph a little more interesting, we can click the Add Sub Aggregation button. Select the Split Bars bucket type. Click the Sub Aggregation drop-down menu and select "Significant Terms", then click the Field drop-down menu and select "clientip.raw", then click the Size field and enter "10". Click the Apply button to create the new graph.
Here is a screenshot of what you should see at this point:
Kibana Visualization Settings
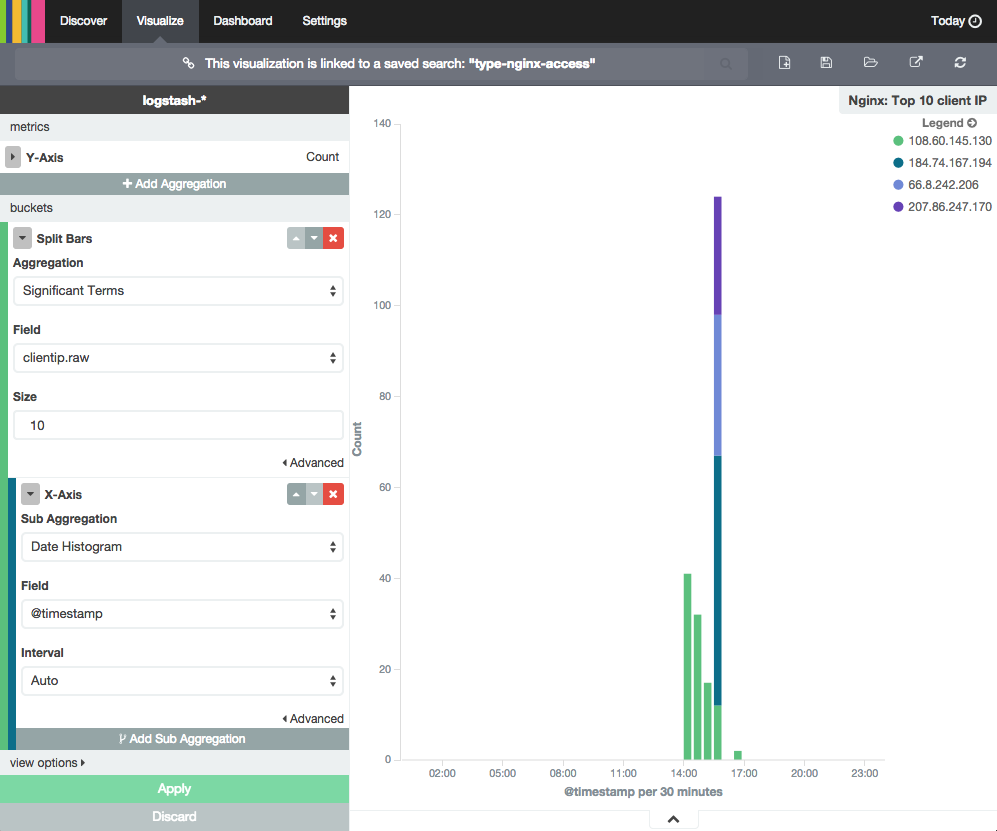
If the logs being visualized were generated by multiple IP addresses (i.e. more than one person is accessing your site), you will see that each bar will be divided into colored segments. Each colored segment represents the Count of logs generated by a specific IP address (i.e. a particular visitor to your site), and the graph will show the up to 10 different segments (because of the Size setting). You can mouseover and click any of the items in the graph to drill down to specific log messages.
When you are ready to save your visualization, click the Save Visualization icon, near the top, then name it and click the Save button.

Create Another Visualization

Before continuing to the next section, where we will demonstrate how to create a dashboard, you should create at least one more visualization. Try and explore the various visualization types.
For example, you could create a pie chart of your top 5 (highest count) log "types". To do this, clickVisualize then select Pie chart. Then use a new search, and leave the search as "" (i.e. all of your logs). Then select *Split Slices** bucket. Click the Aggregation drop-down and select "Significant Terms", click the Field drop-down and select "type.raw", then click the Size field and enter "5". Now click the Applybutton and save the visualization as "Top 5".
Here is a screenshot of the settings that were just described:
Pie chart settings
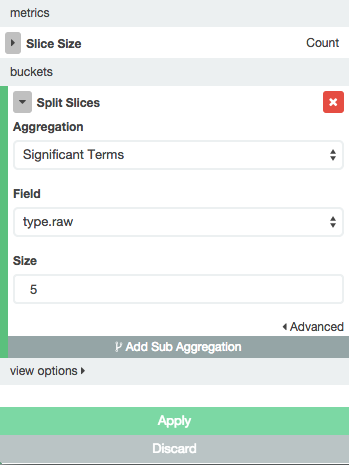
Because, in our example, we're only collecting syslogs and Nginx access logs, there will only be two slices in the pie chart.
Once you are done creating visualizations, let's move on to creating a Kibana dashboard.

Kibana Dashboard

The Kibana Dashboard page is where you can create, modify, and view your own custom dashboards. With a dashboard, you can combine multiple visualizations onto a single page, then filter them by providing a search query or by selecting filters by clicking elements in the visualization. Dashboards are useful for when you want to get an overview of your logs, and make correlations among various visualizations and logs.

Create Dashboard

To create a Kibana dashboard, first, click the Dashboard menu item.
If you haven't created a dashboard before, you will see a mostly blank page that says "Ready to get started?". If you don't see this screen (i.e. there are already visualizations on the dashboard), press theNew Dashboard icon (to the right of the search bar) to get there.
This animation demonstrates how to can add visualizations to your dashboard:
Create a Kibana Dashboard
Here is a breakdown of the steps that are being performed:
  1. Clicked Add Visualization icon
  2. Added "Log Counts" pie chart and "Nginx: Top 10 client IP" histogram
  3. Collapsed the Add Visualization menu
  4. Rearranged and resized the visualizations on the dashboard
  5. Clicked Save Dashboard icon
Choose a name for your dashboard before saving it.
This should give you a good idea of how to create a dashboard. Go ahead and create any dashboards that you think you might want. We'll cover using dashboards next.

Use Dashboard

Dashboards can be filtered further by entering a search query, changing the time filter, or clicking on the elements within the visualization.
For example, if you click on a particular color segment in the histogram, Kibana will allow you to filter on the significant term that the segment represents. Here is an example screenshot of applying a filter to a dashboard:
Filter a dashboard
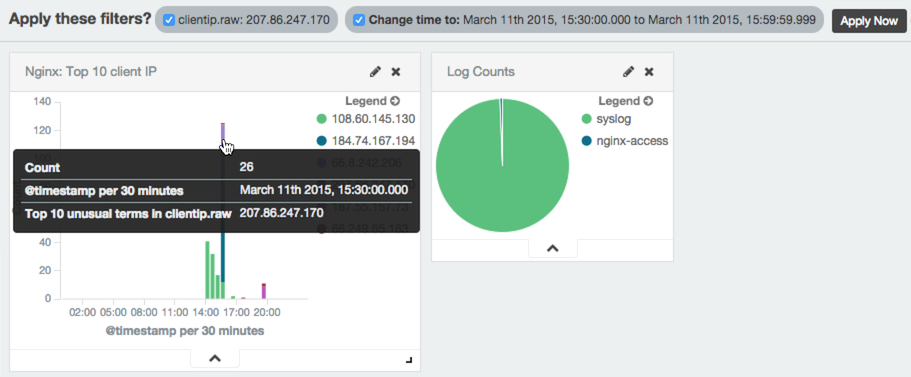
Be sure to click the Apply Now button to filter the results, and redraw the dashboard's visualizations. Filters can be applied and removed as needed.
The search and time filters work just like they do in the Discover page, except they are only applied to the data subsets that are presented in the dashboard.

Kibana Settings

The Kibana Settings page lets you change a variety of things like default values or index patterns. In this tutorial, we will keep it simple and focus on the Indices and Objects sections.

Reload Field Data

When you add new fields to your Logstash data, e.g. if you add a filter for a new log type, you may need to reload your field list. It is necessary to reload the field list if you are unable find filtered fields in Kibana, as this data is only cached periodically.
To do so, click the Settings menu item, then click "logstash-*" (under Index Patterns):
Reload Field List
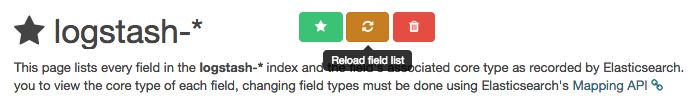
Then click the yellow Reload Field List button. Hit the OK button to confirm.

Edit Saved Objects

The Objects section allows you to edit, view, and delete any of your saved dashboards, searches, and visualizations.
To get there, click on the Settings menu item, then the Objects sub-menu.
Here, you can select from the tabs to find the objects that you want to edit, view, or delete:
Edit Saved Objects
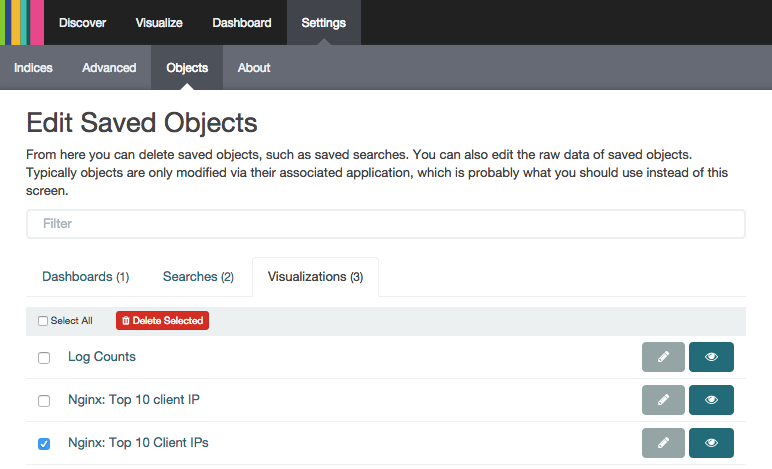
In the screenshot, we have selected a duplicate visualization. It can be edited, viewed, or deleted by clicking on the appropriate button.

Conclusion

If you followed this tutorial, you should have a good understanding of how to use Kibana 4. You should know how to search your log messages, and create visualizations and dashboards.
Be sure to check out the next tutorial in this series, How To Map User Location with GeoIP and ELK
If you have any questions or suggestions, please leave a comment!

Adding Logstash Filters To Improve Centralized Logging

Adding Logstash Filters To Improve Centralized Logging

Adding Logstash Filters To Improve Centralized Logging

Jul 7, 2014  LoggingMonitoring UbuntuCentOS

Introduction

Logstash is a powerful tool for centralizing and analyzing logs, which can help to provide and overview of your environment, and to identify issues with your servers. One way to increase the effectiveness of your Logstash setup is to collect important application logs and structure the log data by employing filters, so the data can be readily analyzed and query-able. We will build our filters around "grok" patterns, that will parse the data in the logs into useful bits of information.
This guide is a sequel to the How To Install Elasticsearch, Logstash, and Kibana 4 on Ubuntu 14.04 tutorial, and focuses primarily on adding filters for various common application logs.

Prerequisites

To follow this tutorial, you must have a working Logstash server, and a way to ship your logs to Logstash. If you do not have Logstash set up, here is another tutorial that will get you started: How To Install Elasticsearch, Logstash, and Kibana 4 on Ubuntu 14.04.
Logstash Server Assumptions:
  • Logstash is installed in /opt/logstash
  • You are receiving logs from Logstash Forwarder on port 5000
  • Your Logstash configuration files are located in /etc/logstash/conf.d
  • You have an input file named 01-lumberjack-input.conf
  • You have an output file named 30-lumberjack-output.conf
Logstash Forwarder Assumptions:
  • You have Logstash Forwarder configured, on each application server, to send syslog/auth.log to your Logstash server (as in the Set Up Logstash Forwarder section of the previous tutorial)
If your setup differs from what we assume, simply adjust this guide to match your environment.
You may need to create the patterns directory by running this command on your Logstash Server:
sudo mkdir -p /opt/logstash/patterns
sudo chown logstash:logstash /opt/logstash/patterns

About Grok

Grok works by parsing text patterns, using regular expressions, and assigning them to an identifier.
The syntax for a grok pattern is %{PATTERN:IDENTIFIER}. A Logstash filter includes a sequence of grok patterns that matches and assigns various pieces of a log message to various identifiers, which is how the logs are given structure.
To learn more about grok, visit the Logstash grok page, and the Logstash Default Patterns listing.

How To Use This Guide

Each main section following this will include the additional configuration details that are necessary to gather and filter logs for a given application. For each application that you want to log and filter, you will have to make some configuration changes on both the application server, and the Logstash server.

Logstash Forwarder Subsection

The Logstash Forwarder subsections pertain to the application server that is sending its logs. The additional files configuration should be added to the /etc/logstash-forwarder.conf file directly after the following lines:
  "files": [
    {
      "paths": [
        "/var/log/syslog",
        "/var/log/auth.log"
       ],
      "fields": { "type": "syslog" }
    }
Ensure that the additional configuration is before the ] that closes the "files" section. This will include the proper log files to send to Logstash, and label them as a specific type (which will be used by the Logstash filters). The Logstash Forwarder must be reloaded to put any changes into effect.

Logstash Patterns Subsection

If there is a Logstash Patterns subsection, it will contain grok patterns that can be added to a new file in/opt/logstash/patterns on the Logstash Server. This will allow you to use the new patterns in Logstash filters.

Logstash Filter Subsection

The Logstash Filter subsections will include a filter that can can be added to a new file, between the input and output configuration files, in /etc/logstash/conf.d on the Logstash Server. The filter determine how the Logstash server parses the relevant log files. Remember to restart the Logstash server after adding a new filter, to load your changes.
Now that you know how to use this guide, the rest of the guide will show you how to gather and filter application logs!

Application: Nginx

Logstash Forwarder: Nginx

On your Nginx servers, open the logstash-forwarder.conf configuration file for editing:
sudo vi /etc/logstash-forwarder.conf
Add the following, in the "files" section, to send the Nginx access logs as type "nginx-access" to your Logstash server:
,
    {
      "paths": [
        "/var/log/nginx/access.log"
       ],
      "fields": { "type": "nginx-access" }
    }
Save and exit. Reload the Logstash Forwarder configuration to put the changes into effect:
sudo service logstash-forwarder restart

Logstash Patterns: Nginx

Nginx log patterns are not included in Logstash's default patterns, so we will add Nginx patterns manually.
On your Logstash server, create a new pattern file called nginx:
sudo vi /opt/logstash/patterns/nginx
Then insert the following lines:
NGUSERNAME [a-zA-Z\.\@\-\+_%]+
NGUSER %{NGUSERNAME}
NGINXACCESS %{IPORHOST:clientip} %{NGUSER:ident} %{NGUSER:auth} \[%{HTTPDATE:timestamp}\] "%{WORD:verb} %{URIPATHPARAM:request} HTTP/%{NUMBER:httpversion}" %{NUMBER:response} (?:%{NUMBER:bytes}|-) (?:"(?:%{URI:referrer}|-)"|%{QS:referrer}) %{QS:agent}
Save and exit. The NGINXACCESS pattern parses, and assigns the data to various identifiers (e.g. clientip, ident, auth, etc.).
Next, change the ownership of the pattern file to logstash:
sudo chown logstash:logstash /opt/logstash/patterns/nginx

Logstash Filter: Nginx

On your Logstash server, create a new filter configuration file called 11-nginx.conf:
sudo vi /etc/logstash/conf.d/11-nginx.conf
Then add the following filter:
filter {
  if [type] == "nginx-access" {
    grok {
      match => { "message" => "%{NGINXACCESS}" }
    }
  }
}
Save and exit. Note that this filter will attempt to match messages of "nginx-access" type with the NGINXACCESS pattern, defined above.
Now restart Logstash to reload the configuration:
sudo service logstash restart
Now your Nginx logs will be gathered and filtered!

Application: Apache HTTP Web Server

Apache's log patterns are included in the default Logstash patterns, so it is fairly easy to set up a filter for it.
Note: If you are using a RedHat variant, such as CentOS, the logs are located at /var/log/httpdinstead of /var/log/apache2, which is used in the examples.

Logstash Forwarder

On your Apache servers, open the logstash-forwarder.conf configuration file for editing:
sudo vi /etc/logstash-forwarder.conf
Add the following, in the "files" section, to send the Apache access logs as type "apache-access" to your Logstash server:
,
    {
      "paths": [
        "/var/log/apache2/access.log"
       ],
      "fields": { "type": "apache-access" }
    }
Save and exit. Reload the Logstash Forwarder configuration to put the changes into effect:
sudo service logstash-forwarder restart

Logstash Filter: Apache

On your Logstash server, create a new filter configuration file called 12-apache.conf:
sudo vi /etc/logstash/conf.d/12-apache.conf
Then add the following filter:
filter {
  if [type] == "apache-access" {
    grok {
      match => { "message" => "%{COMBINEDAPACHELOG}" }
    }
  }
}
Save and exit. Note that this filter will attempt to match messages of "apache-access" type with the COMBINEDAPACHELOG pattern, one the default Logstash patterns.
Now restart Logstash to reload the configuration:
sudo service logstash restart
Now your Apache logs will be gathered and filtered!

Conclusion

It is possible to collect and parse logs of pretty much any type. Try and write your own filters and patterns for other log files.
Feel free to comment with filters that you would like to see, or with patterns of your own!
If you aren't familiar with using Kibana, check out the third tutorial in this series: How To Use Kibana Visualizations and Dashboards.

How To Install Elasticsearch, Logstash, and Kibana 4 on CentOS 7

How To Install Elasticsearch, Logstash, and Kibana 4 on CentOS 7

Mar 10, 2015  LoggingNginxMonitoring CentOS

Introduction

In this tutorial, we will go over the installation of the Elasticsearch ELK Stack on CentOS 7—that is, Elasticsearch 1.4.4, Logstash 1.5.0, and Kibana 4. We will also show you how to configure it to gather and visualize the syslogs of your systems in a centralized location. Logstash is an open source tool for collecting, parsing, and storing logs for future use. Kibana 4 is a web interface that can be used to search and view the logs that Logstash has indexed. Both of these tools are based on Elasticsearch.
Centralized logging can be very useful when attempting to identify problems with your servers or applications, as it allows you to search through all of your logs in a single place. It is also useful because it allows you to identify issues that span multiple servers by correlating their logs during a specific time frame.
It is possible to use Logstash to gather logs of all types, but we will limit the scope of this tutorial to syslog gathering.

Our Goal

The goal of the tutorial is to set up Logstash to gather syslogs of multiple servers, and set up Kibana to visualize the gathered logs.
Our Logstash / Kibana setup has four main components:
  • Logstash: The server component of Logstash that processes incoming logs
  • Elasticsearch: Stores all of the logs
  • Kibana 4: Web interface for searching and visualizing logs, which will be proxied through Nginx
  • Logstash Forwarder: Installed on servers that will send their logs to Logstash, Logstash Forwarder serves as a log forwarding agent that utilizes the lumberjack networking protocol to communicate with Logstash
ELK Infrastructure
We will install the first three components on a single server, which we will refer to as our Logstash Server. The Logstash Forwarder will be installed on all of the client servers that we want to gather logs for, which we will refer to collectively as our Client Servers.

Prerequisites

To complete this tutorial, you will require root access to an CentOS 7 VPS. Instructions to set that up can be found here (steps 3 and 4): Initial Server Setup with CentOS 7.
If you would prefer to use Ubuntu instead, check out this tutorial: How To Install ELK on Ubuntu 14.04.
The amount of CPU, RAM, and storage that your Logstash Server will require depends on the volume of logs that you intend to gather. For this tutorial, we will be using a VPS with the following specs for our Logstash Server:
  • OS: CentOS 7
  • RAM: 4GB
  • CPU: 2
In addition to your Logstash Server, you will want to have a few other servers that you will gather logs from.
Let's get started on setting up our Logstash Server!

Install Java 8

Elasticsearch and Logstash require Java, so we will install that now. We will install Oracle Java 8 update 40 because Elasticsearch recommends at least Java 8 update 20. It should, however, work fine with OpenJDK, if you decide to go that route. Following the steps in this section means that you accept the Oracle Binary License Agreement for Java SE.
Change to the /opt directory and download the Oracle Java 8 JRE .tar.gz archive with these command:
  • cd /opt
  • sudo wget --no-cookies --no-check-certificate --header "Cookie: gpw_e24=http%3A%2F%2Fwww.oracle.com%2F; oraclelicense=accept-securebackup-cookie" \
  • "http://download.oracle.com/otn-pub/java/jdk/8u40-b25/jre-8u40-linux-x64.tar.gz"
Extract the archive that you just downloaded with this command:
  • sudo tar xvf jre-8*.tar.gz
This will produce a directory based on the release that you downloaded, e.g. jre1.8.0_40. Change the ownership of the extracted files to root:
  • sudo chown -R root: jre1.8*
The JRE executable files, e.g. java among others, are now installed at /opt/jre1.8.0_40/bin which is not in your PATH environment variable, so the commands can only be used if you reference their locations. To remedy this, you can either add this directory to your PATH or use the alternativescommand to add symbolic links to individual executable files to the /usr/bin directory. We will show you how to use the alternatives command to add your Java executable.
Use this alternatives command to add a symbolic link, in the /usr/bin directory, to the java command:
  • sudo alternatives --install /usr/bin/java java /opt/jre1.8*/bin/java 1
You may delete the Java archive file that you downloaded earlier:
  • sudo rm /opt/jre-8*.tar.gz
Now that Java 8 is installed, let's install ElasticSearch.

Install Elasticsearch

Run the following command to import the Elasticsearch public GPG key into rpm:
  • sudo rpm --import http://packages.elasticsearch.org/GPG-KEY-elasticsearch
Create and edit a new yum repository file for Elasticsearch:
  • sudo vi /etc/yum.repos.d/elasticsearch.repo
Add the following repository configuration:
/etc/yum.repos.d/elasticsearch.repo
  • [elasticsearch-1.4]
  • name=Elasticsearch repository for 1.4.x packages
  • baseurl=http://packages.elasticsearch.org/elasticsearch/1.4/centos
  • gpgcheck=1
  • gpgkey=http://packages.elasticsearch.org/GPG-KEY-elasticsearch
  • enabled=1
Save and exit.
Install Elasticsearch 1.4.4 with this command:
  • sudo yum -y install elasticsearch-1.4.4
Elasticsearch is now installed. Let's edit the configuration:
  • sudo vi /etc/elasticsearch/elasticsearch.yml
You will want to restrict outside access to your Elasticsearch instance (port 9200), so outsiders can't read your data or shutdown your Elasticsearch cluster through the HTTP API. Find the line that specifiesnetwork.host, uncomment it, and replace its value with "localhost" so it looks like this:
elasticsearch.yml excerpt (updated)
network.host: localhost
Save and exit elasticsearch.yml.
Now start Elasticsearch:
  • sudo systemctl start elasticsearch
Then run the following command to start Elasticsearch automatically on boot up:
  • sudo systemctl enable elasticsearch
Now that Elasticsearch is up and running, let's install Kibana.

Install Kibana

Download Kibana 4 to your home directory with the following command:
  • cd ~; wget https://download.elasticsearch.org/kibana/kibana/kibana-4.0.1-linux-x64.tar.gz
Extract Kibana archive with tar:
  • tar xvf kibana-*.tar.gz
Open the Kibana configuration file for editing:
  • vi ~/kibana-4*/config/kibana.yml
In the Kibana configuration file, find the line that specifies host, and replace the IP address ("0.0.0.0" by default) with "localhost":
kibana.yml excerpt (updated)
host: "localhost"
Save and exit. This setting makes it so Kibana will only be accessible to the localhost. This is fine because we will use an Nginx reverse proxy to allow external access.
Let's copy the Kibana files to a more appropriate location. Create the /opt directory with the following command:
  • sudo mkdir -p /opt/kibana
Now copy the Kibana files into your newly-created directory:
  • sudo cp -R ~/kibana-4*/* /opt/kibana/
Kibana can be started by running /opt/kibana/bin/kibana, but we want it to run as a service. Create the Kibana systemd init file using vi:
  • sudo vi /etc/systemd/system/kibana4.service
Now paste in this Kibana init file:
/etc/systemd/system/kibana4.service
  • [Service]
  • ExecStart=/opt/kibana/bin/kibana
  • Restart=always
  • StandardOutput=syslog
  • StandardError=syslog
  • SyslogIdentifier=kibana4
  • User=root
  • Group=root
  • Environment=NODE_ENV=production
  • [Install]
  • WantedBy=multi-user.target
Save and exit.
Now start the Kibana service, and enable it:
  • sudo systemctl start kibana4
  • sudo systemctl enable kibana4
Before we can use the Kibana web interface, we have to set up a reverse proxy. Let's do that now, with Nginx.

Install Nginx

Because we configured Kibana to listen on localhost, we must set up a reverse proxy to allow external access to it. We will use Nginx for this purpose.
Note: If you already have an Nginx instance that you want to use, feel free to use that instead. Just make sure to configure Kibana so it is reachable by your Nginx server (you probably want to change the hostvalue, in /opt/kibana/config/kibana.yml, to your Kibana server's private IP address). Also, it is recommended that you enable SSL/TLS.
Add the EPEL repository to yum:
  • sudo yum -y install epel-release
Now use yum to install Nginx and httpd-tools:
  • sudo yum -y install nginx httpd-tools
Use htpasswd to create an admin user, called "kibanaadmin" (you should use another name), that can access the Kibana web interface:
  • sudo htpasswd -c /etc/nginx/htpasswd.users kibanaadmin
Enter a password at the prompt. Remember this login, as you will need it to access the Kibana web interface.
Now open the Nginx configuration file in your favorite editor. We will use vi:
  • sudo vi /etc/nginx/nginx.conf
Find the default server block (starts with server {), the last configuration block in the file, and delete it. When you are done, the last two lines in the file should look like this:
nginx.conf excerpt
    include /etc/nginx/conf.d/*.conf;
}
Save and exit.
Now we will create an Nginx server block in a new file:
  • sudo vi /etc/nginx/conf.d/kibana.conf
Paste the following code block into the file. Be sure to update the server_name to match your server's name:
/etc/nginx/conf.d/kibana.conf
  • server {
  • listen 80;
  • server_name example.com;
  • auth_basic "Restricted Access";
  • auth_basic_user_file /etc/nginx/htpasswd.users;
  • location / {
  • proxy_pass http://localhost:5601;
  • proxy_http_version 1.1;
  • proxy_set_header Upgrade $http_upgrade;
  • proxy_set_header Connection 'upgrade';
  • proxy_set_header Host $host;
  • proxy_cache_bypass $http_upgrade;
  • }
  • }
Save and exit. This configures Nginx to direct your server's HTTP traffic to the Kibana application, which is listening on localhost:5601. Also, Nginx will use the htpasswd.users file, that we created earlier, and require basic authentication.
Now start and enable Nginx to put our changes into effect:
  • sudo systemctl start nginx
  • sudo systemctl enable nginx
Note: This tutorial assumes that SELinux is disabled. If this is not the case, you may need to run the following command for Kibana to work properly: sudo setsebool -P httpd_can_network_connect 1
Kibana is now accessible via your FQDN or the public IP address of your Logstash Server i.e. http://logstash_server_public_ip/. If you go there in a web browser, after entering the "kibanaadmin" credentials, you should see a Kibana welcome page which will ask you to configure an index pattern. Let's get back to that later, after we install all of the other components.

Install Logstash

The Logstash package shares the same GPG Key as Elasticsearch, and we already installed that public key, so let's create and edit a new Yum repository file for Logstash:
  • sudo vi /etc/yum.repos.d/logstash.repo
Add the following repository configuration:
/etc/yum.repos.d/logstash.repo
  • [logstash-1.5]
  • name=logstash repository for 1.5.x packages
  • baseurl=http://packages.elasticsearch.org/logstash/1.5/centos
  • gpgcheck=1
  • gpgkey=http://packages.elasticsearch.org/GPG-KEY-elasticsearch
  • enabled=1
Save and exit.
Install Logstash 1.5 with this command:
  • sudo yum -y install logstash
Logstash is installed but it is not configured yet.

Generate SSL Certificates

Since we are going to use Logstash Forwarder to ship logs from our Servers to our Logstash Server, we need to create an SSL certificate and key pair. The certificate is used by the Logstash Forwarder to verify the identity of Logstash Server.
Now you have two options for generating your SSL certificates. If you have a DNS setup that will allow your client servers to resolve the IP address of the Logstash Server, use Option 2. Otherwise, Option 1 will allow you to use IP addresses.

Option 1: IP Address

If you don't have a DNS setup—that would allow your servers, that you will gather logs from, to resolve the IP address of your Logstash Server—you will have to add your Logstash Server's private IP address to thesubjectAltName (SAN) field of the SSL certificate that we are about to generate. To do so, open the OpenSSL configuration file:
  • sudo vi /etc/pki/tls/openssl.cnf
Find the [ v3_ca ] section in the file, and add this line under it (substituting in the Logstash Server's private IP address):
openssl.cnf excerpt
  • subjectAltName = IP: logstash_server_private_ip
Save and exit.
Now generate the SSL certificate and private key in the appropriate locations (/etc/pki/tls/), with the following commands:
  • cd /etc/pki/tls
  • sudo openssl req -config /etc/pki/tls/openssl.cnf -x509 -days 3650 -batch -nodes -newkey rsa:2048 -keyout private/logstash-forwarder.key -out certs/logstash-forwarder.crt
The logstash-forwarder.crt file will be copied to all of the servers that will send logs to Logstash but we will do that a little later. Let's complete our Logstash configuration. If you went with this option, skip option 2 and move on to Configure Logstash.

Option 2: FQDN (DNS)

If you have a DNS setup with your private networking, you should create an A record that contains the Logstash Server's private IP address—this domain name will be used in the next command, to generate the SSL certificate. Alternatively, you can use a record that points to the server's public IP address. Just be sure that your servers (the ones that you will be gathering logs from) will be able to resolve the domain name to your Logstash Server.
Now generate the SSL certificate and private key, in the appropriate locations (/etc/pki/tls/...), with the following command (substitute in the FQDN of the Logstash Server):
  • cd /etc/pki/tls
  • sudo openssl req -subj '/CN=logstash_server_fqdn/' -x509 -days 3650 -batch -nodes -newkey rsa:2048 -keyout private/logstash-forwarder.key -out certs/logstash-forwarder.crt
The logstash-forwarder.crt file will be copied to all of the servers that will send logs to Logstash but we will do that a little later. Let's complete our Logstash configuration.

Configure Logstash

Logstash configuration files are in the JSON-format, and reside in /etc/logstash/conf.d. The configuration consists of three sections: inputs, filters, and outputs.
Let's create a configuration file called 01-lumberjack-input.conf and set up our "lumberjack" input (the protocol that Logstash Forwarder uses):
  • sudo vi /etc/logstash/conf.d/01-lumberjack-input.conf
Insert the following input configuration:
/etc/logstash/conf.d/01-lumberjack-input.conf
  • input {
  • lumberjack {
  • port => 5000
  • type => "logs"
  • ssl_certificate => "/etc/pki/tls/certs/logstash-forwarder.crt"
  • ssl_key => "/etc/pki/tls/private/logstash-forwarder.key"
  • }
  • }
Save and quit. This specifies a lumberjack input that will listen on tcp port 5000, and it will use the SSL certificate and private key that we created earlier.
Now let's create a configuration file called 10-syslog.conf, where we will add a filter for syslog messages:
  • sudo vi /etc/logstash/conf.d/10-syslog.conf
Insert the following syslog filter configuration:
/etc/logstash/conf.d/10-syslog.conf
  • filter {
  • if [type] == "syslog" {
  • grok {
  • match => { "message" => "%{SYSLOGTIMESTAMP:syslog_timestamp} %{SYSLOGHOST:syslog_hostname} %{DATA:syslog_program}(?:\[%{POSINT:syslog_pid}\])?: %{GREEDYDATA:syslog_message}" }
  • add_field => [ "received_at", "%{@timestamp}" ]
  • add_field => [ "received_from", "%{host}" ]
  • }
  • syslog_pri { }
  • date {
  • match => [ "syslog_timestamp", "MMM d HH:mm:ss", "MMM dd HH:mm:ss" ]
  • }
  • }
  • }
Save and quit. This filter looks for logs that are labeled as "syslog" type (by a Logstash Forwarder), and it will try to use "grok" to parse incoming syslog logs to make it structured and query-able.
Lastly, we will create a configuration file called 30-lumberjack-output.conf:
  • sudo vi /etc/logstash/conf.d/30-lumberjack-output.conf
Insert the following output configuration:
/etc/logstash/conf.d/30-lumberjack-output.conf
  • output {
  • elasticsearch { host => localhost }
  • stdout { codec => rubydebug }
  • }
Save and exit. This output basically configures Logstash to store the logs in Elasticsearch.
With this configuration, Logstash will also accept logs that do not match the filter, but the data will not be structured (e.g. unfiltered Nginx or Apache logs would appear as flat messages instead of categorizing messages by HTTP response codes, source IP addresses, served files, etc.).
If you want to add filters for other applications that use the Logstash Forwarder input, be sure to name the files so they sort between the input and the output configuration (i.e. between 01- and 30-).
Restart and enable Logstash to put our configuration changes into effect:
  • sudo systemctl restart logstash
Now that our Logstash Server is ready, let's move onto setting up Logstash Forwarder.

Set Up Logstash Forwarder (Add Client Servers)

Do these steps for each CentOS or RHEL 7 server that you want to send logs to your Logstash Server. For instructions on installing Logstash Forwarder on Debian-based Linux distributions (e.g. Ubuntu, Debian, etc.), refer to the Build and Package Logstash Forwarder section of the Ubuntu variation of this tutorial.

Copy SSL Certificate and Logstash Forwarder Package

On Logstash Server, copy the SSL certificate to Client Server (substitute the client server's IP address, and your own login):
  • scp /etc/pki/tls/certs/logstash-forwarder.crt user@server_private_IP:/tmp
After providing the login credentials, ensure that the certificate copy was successful. It is required for communication between the client servers and the Logstash server.

Install Logstash Forwarder Package

On Client Server, create run the following command to import the Elasticsearch public GPG key into rpm:
  • sudo rpm --import http://packages.elasticsearch.org/GPG-KEY-elasticsearch
Create and edit a new yum repository file for Logstash Forwarder:
  • sudo vi /etc/yum.repos.d/logstash-forwarder.repo
Add the following repository configuration:
/etc/yum.repos.d/logstash-forwarder.repo
  • [logstash-forwarder]
  • name=logstash-forwarder repository
  • baseurl=http://packages.elasticsearch.org/logstashforwarder/centos
  • gpgcheck=1
  • gpgkey=http://packages.elasticsearch.org/GPG-KEY-elasticsearch
  • enabled=1
Save and exit.
Then install the Logstash Forwarder package:
  • sudo yum -y install logstash-forwarder
Now copy the Logstash server's SSL certificate into the appropriate location (/etc/pki/tls/certs):
  • sudo cp /tmp/logstash-forwarder.crt /etc/pki/tls/certs/

Configure Logstash Forwarder

On Client Server, create and edit Logstash Forwarder configuration file, which is in JSON format:
  • sudo vi /etc/logstash-forwarder.conf
Under the network section, add the following lines into the file, substituting in your Logstash Server's private IP address for logstash_server_private_IP:
logstash-forwarder.conf excerpt 1 of 2
    "servers": [ "logstash_server_private_IP:5000" ],
    "timeout": 15,
    "ssl ca": "/etc/pki/tls/certs/logstash-forwarder.crt"
Under the files section (between the square brackets), add the following lines,
logstash-forwarder.conf excerpt 2 of 2
    {
      "paths": [
        "/var/log/messages",
        "/var/log/secure"
       ],
      "fields": { "type": "syslog" }
    }
Save and quit. This configures Logstash Forwarder to connect to your Logstash Server on port 5000 (the port that we specified an input for earlier), and uses the SSL certificate that we created earlier. The pathssection specifies which log files to send (here we specify syslog and auth.log), and the type section specifies that these logs are of type "syslog* (which is the type that our filter is looking for).
Note that this is where you would add more files/types to configure Logstash Forwarder to other log files to Logstash on port 5000.
Now restart Logstash Forwarder to put our changes into place:
  • sudo service logstash-forwarder restart
Now Logstash Forwarder is sending your syslog messages and secure files to your Logstash Server! Repeat this section for all of the other servers that you wish to gather logs for.

Connect to Kibana

When you are finished setting up Logstash Forwarder on all of the servers that you want to gather logs for, let's look at Kibana, the web interface that we installed earlier.
In a web browser, go to the FQDN or public IP address of your Logstash Server. After entering the "kibanaadmin" credentials, you should see a page prompting you to configure an index pattern:
Create index
Go ahead and select @timestamp from the dropdown menu, then click the Create button to create the first index.
Now click the Discover link in the top navigation bar. By default, this will show you all of the log data over the last 15 minutes. You should see a histogram with log events, with log messages below:
Discover page
Right now, there won't be much in there because you are only gathering syslogs from your client servers. Here, you can search and browse through your logs. You can also customize your dashboard.
Try the following things:
  • Search for "root" to see if anyone is trying to log into your servers as root
  • Search for a particular hostname (search for host: "hostname")
  • Change the time frame by selecting an area on the histogram or from the menu above
  • Click on messages below the histogram to see how the data is being filtered
Kibana has many other features, such as graphing and filtering, so feel free to poke around!

Conclusion

Now that your syslogs are centralized via Elasticsearch and Logstash, and you are able to visualize them with Kibana 4, you should be off to a good start with centralizing all of your important logs. Remember that you can send pretty much any type of log to Logstash, but the data becomes even more useful if it is parsed and structured with grok.
To improve your new ELK stack, you should look into gathering and filtering your other logs with Logstash, and creating Kibana dashboards. These topics are covered in the second and third tutorials in this series.
Scroll down for links to learn more about using your ELK stack!