Tuesday 6 October 2015

How to Add Ngx_pagespeed to Nginx on CentOS 7

Introduction

Ngx_pagespeed, or just pagespeed, is an Nginx module designed to optimize your site automatically by reducing the size of its resources and hence the time the clients' browsers need to load it. If you are not acquainted with it already, please check its official site.
This article will guide you through the installation and configuration of the pagespeed module for Nginx. It's important to know that Nginx does not support Dynamic Loading of Modules available in other web servers such as Apache. Since Nginx doesn't support this feature, you need to build Nginx from source to add the module.
Having your own custom package comes with one disadvantage — you are solely responsible for updating it when there is a new version. Take this into account when weighing the pros and cons of using ngx_pagespeed. 

Prerequisites

This guide has been written for CentOS 7. You will probably face software dependency and inconsistency problems with other CentOS versions and Linux distributions.
Before following this tutorial, please make sure you complete the following prerequisites:
Except otherwise noted, all of the commands that require root privileges in this tutorial should be run as a non-root user with sudo privileges.

Step 1 — Download the Source and Its Dependencies

Let's start with ensuring we have all the necessary software for the compilation and testing of Nginx. Please run the command:
  • sudo yum install wget curl unzip gcc-c++ pcre-devel zlib-devel
Next, create a folder in your home directory to download the source package for Nginx:
  • mkdir ~/custom-nginx
Change to this newly created directory:
  • cd ~/custom-nginx
Then, download the Nginx source package in this directory from its official site. Currently, the latest version is 1.8.0 and can be downloaded with the command:
  • sudo wget http://nginx.org/download/nginx-1.8.0.tar.gz
After that extract the newly downloaded package with the command:
  • sudo tar zxvf nginx-1.8.0.tar.gz
To confirm we are on the same page, list the content of the folder ~/custom-nginx:
  • ls ~/custom-nginx
The result should look like this:
Output of ls ~/custom-nginx
nginx-1.8.0 nginx-1.8.0.tar.gz
As you can see, the version of the Nginx source package is 1.8.0 at the time of writing this tutorial. To start adding the ngx_pagespeed module, you first need to go to the modules folder within the extracted folder nginx-1.8.0:
  • cd nginx-1.8.0/src/http/modules/
In this directory, download the latest ngx_pagespeed source archive from its Github repository with the command:
  • sudo wget https://github.com/pagespeed/ngx_pagespeed/archive/master.zip
Once the download completes, extract it with the unzip utility like this:
  • sudo unzip master.zip
This will create a new directory called ngx_pagespeed-master inside your ~/custom-nginx/nginx-1.8.0/src/http/modules/ directory. For convenience rename this directory to just ngx_pagespeedwith the command:
  • sudo mv ngx_pagespeed-master ngx_pagespeed
Go inside the new ngx_pagespeed directory:
  • cd ngx_pagespeed
From there, download the PageSpeed Optimization Libraries (psol) which are required for the compilation:
  • sudo wget https://dl.google.com/dl/page-speed/psol/1.9.32.6.tar.gz
If the link to the psol archive is not working at the time you are reading this article, just skip this step. If you are missing the libraries during the compilation in the next steps, you will see an error with updated instructions for how to get the package later.
Finally, extract the psol package inside the ~/custom-nginx/nginx-1.4.6/debian/modules/ngx_pagespeed directory:
  • sudo tar -xzvf 1.9.32.6.tar.gz

Step 2 — Configure the Source and Compile It

At this point you are ready to configure the Nginx source and include the pagespeed module. Go to the parent directory of the Nginx source:
  • cd ~/custom-nginx/nginx-1.8.0/
There run the configure the source with the command:
  • sudo ./configure --add-module=/home/your_user/custom-nginx/nginx-1.8.0/src/http/modules/ngx_pagespeed/ --user=nobody --group=nobody --error-log-path=/var/log/nginx/error.log --http-log-path=/var/log/nginx/access.log --pid-path=/var/run/nginx.pid
The most important configuration option from the above is --add-module=/home/your_user/custom-nginx/nginx-1.8.0/src/http/modules/ngx_pagespeed/. It ensures that the pagespeed module will be part of the Nginx compilation. Please make sure to replace your_user with your user in this path.
For convenience, we have customized a few other settings such as the location of the log files and the user/group under which the server should run. For more information on what can be customized please check the documentation for the compile-time options.
Once the configuration completes, start the compilation with the command:
  • sudo make
This will take up to ten minutes depending on your droplet's resources. After that you can install the software with the command:
  • sudo make install
You can find your custom Nginx installed in the directory /usr/local/nginx. To make it even more convenient, let's create two symbolic links. First for the configuration files:
  • sudo ln -s /usr/local/nginx/conf/ /etc/nginx
This command will allow you to find the configuration files in the /etc/nginx/ directory where usually configuration files reside.
You should also create a symbolic link to the main binary in the /usr/sbin/ directory so that you can find it more easily and include it in the startup script. This will be also needed for the startup script which we'll use later. For this purpose run the command:
  • sudo ln -s /usr/local/nginx/sbin/nginx /usr/sbin/nginx

Step 3 — Create the Startup Script

The previous installation process takes care of some mundane tasks such as creating the necessary nobody user and group, under which Nginx will run. However, you still have to create manually startup script. Luckily, for Nginx on CentOS 7 there is already one readily available on nginx.com
First, create a new file in the directory /etc/init.d/:
  • sudo nano /etc/init.d/nginx
Then go to https://www.nginx.com/resources/wiki/start/topics/examples/redhatnginxinit/, copy the script, and paste it in this new file.
Finally, make this script executable by running the command:
  • sudo chmod +x /etc/init.d/nginx
After that you can start Nginx for the first time with the command:
  • sudo service nginx start
To make sure that Nginx starts and stops every time with the Droplet, add it to the default runlevels with the command:
  • sudo chkconfig nginx on

Step 4 — Enable the Pagespeed Module

You now have Nginx installed. The next step is to enable the ngx_pagespeed module.
Before enabling the module, you have to create a folder, where it will cache the files for your website:
  • sudo mkdir -p /var/ngx_pagespeed_cache
Make sure to change the ownership of this folder to the Nginx user so that the web server can store files in it:
  • sudo chown -R nobody:nobody /var/ngx_pagespeed_cache
Then open the main Nginx configuration file nginx.conf in your favorite text editor like this:
  • sudo nano /etc/nginx/nginx.conf
In this file add the following lines to the server block and save the changes:
/etc/nginx/nginx.conf
##
# Pagespeed main settings

pagespeed on;
pagespeed FileCachePath /var/ngx_pagespeed_cache;

# Ensure requests for pagespeed optimized resources go to the pagespeed
# handler and no extraneous headers get set.

location ~ "\.pagespeed\.([a-z]\.)?[a-z]{2}\.[^.]{10}\.[^.]+" { add_header "" ""; }
location ~ "^/ngx_pagespeed_static/" { }
location ~ "^/ngx_pagespeed_beacon" { }
This is how the /etc/nginx/nginx.conf file should look now:
/etc/nginx/nginx.conf
...
http {
    include       mime.types;
    default_type  application/octet-stream;

    #log_format  main  '$remote_addr - $remote_user [$time_local] "$request" '
    #                  '$status $body_bytes_sent "$http_referer" '
    #                  '"$http_user_agent" "$http_x_forwarded_for"';

    #access_log  logs/access.log  main;

    sendfile        on;
    #tcp_nopush     on;

    #keepalive_timeout  0;
    keepalive_timeout  65;

    #gzip  on;

    server {
        listen       80;
        server_name  localhost;

        #charset koi8-r;

        #access_log  logs/host.access.log  main;

        ##
        # Pagespeed main settings

        pagespeed on;
        pagespeed FileCachePath /var/ngx_pagespeed_cache;

        # Ensure requests for pagespeed optimized resources go to the pagespeed
        # handler and no extraneous headers get set.

        location ~ "\.pagespeed\.([a-z]\.)?[a-z]{2}\.[^.]{10}\.[^.]+" { add_header "" ""; }
        location ~ "^/ngx_pagespeed_static/" { }
        location ~ "^/ngx_pagespeed_beacon" { }

        location / {
            root   html;
            index  index.html index.htm;
        }
...
Also, make sure to add pagespeed configuration lines to every additional server block file you may have.
Finally, restart Nginx server for the changes to take effect:
  • sudo service nginx restart

Step 5 — Test the Installation

To check if ngx_pagespeed module has been installed successfully, run the Nginx binary like this:
  • sudo /usr/sbin/nginx -V
If the installation was successful, you should see the ngx_pagespeed module listed among the other custom arguments:
Output
nginx version: nginx/1.8.0 ... configure arguments: --add-module=/home/your_user/custom-nginx/nginx-1.8.0/src/http/modules/ngx_pagespeed/ ...
The above doesn't mean yet that the pagespeed is enabled and works for your site. To confirm this you can use curl, a tool and a library for client-side URL transfers. With it check for the X-Page-Speedheader like this:
  • curl -I -p http://localhost| grep X-Page-Speed
If the ngx_pagespeed module works fine, you should see it in the output along with its version:
Output
X-Page-Speed: 1.9.32.6-7321
If you don't see this header, make sure that you have enabled pagespeed as per the instructions from the previous step.

Conclusion

That's how you can build Nginx with a custom module, pagespeed. These steps are valid for any other module that is not already available in Nginx. Furthermore, the whole process for installing a package from source is similar for other software packages you might need to customize. Just don't forget that you will have to maintain and re-install these packages by yourself when there is a new version.

Monday 28 September 2015

How To Use Kibana Dashboards and Visualizations

How To Use Kibana Dashboards and Visualizations

How To Use Kibana Dashboards and Visualizations

Mar 12, 2015  Logging

Introduction

Kibana 4 is an analytics and visualization platform that builds on Elasticsearch to give you a better understanding of your data. In this tutorial, we will get you started with Kibana, by showing you how to use its interface to filter and visualize log messages gathered by an Elasticsearch ELK stack. We will cover the main interface components, and demonstrate how to create searches, visualizations, and dashboards.

Prerequisites

This tutorial is the third part in the Centralized Logging with Logstash and Kibana series.
It assumes that you have a working ELK setup. The examples assume that you are gathering syslog and Nginx access logs. If you are not gathering these types of logs, you should be able to modify the demonstrations to work with your own log messages.
If you want to follow this tutorial exactly as presented, you should have the following setup, by following the first two tutorials in this series:
When you are ready to move on, let's look at an overview of the Kibana interface.

Kibana Interface Overview

The Kibana interface is divided into four main sections:
  • Discover
  • Visualize
  • Dashboard
  • Settings
We will go over the basics of each section, in the listed order, and demonstrate how each piece of the interface can be used.

Kibana Discover

When you first connect to Kibana 4, you will be taken to the Discover page. By default, this page will display all of your ELK stack's most recently received logs. Here, you can filter through and find specific log messages based on Search Queries, then narrow the search results to a specific time range with theTime Filter.
Here is a breakdown of the Kibana Discover interface elements:
  • Search Bar: Directly under the main navigation menu. Use this to search specific fields and/or entire messages
  • Time Filter: Top-right (clock icon). Use this to filter logs based on various relative and absolute time ranges
  • Field Selector: Left, under the search bar. Select fields to modify which ones are displayed in theLog View
  • Date Histogram: Bar graph under the search bar. By default, this shows the count of all logs, versus time (x-axis), matched by the search and time filter. You can click on bars, or click-and-drag, to narrow the time filter
  • Log View: Bottom-right. Use this to look at individual log messages, and display log data filtered by fields. If no fields are selected, entire log messages are displayed
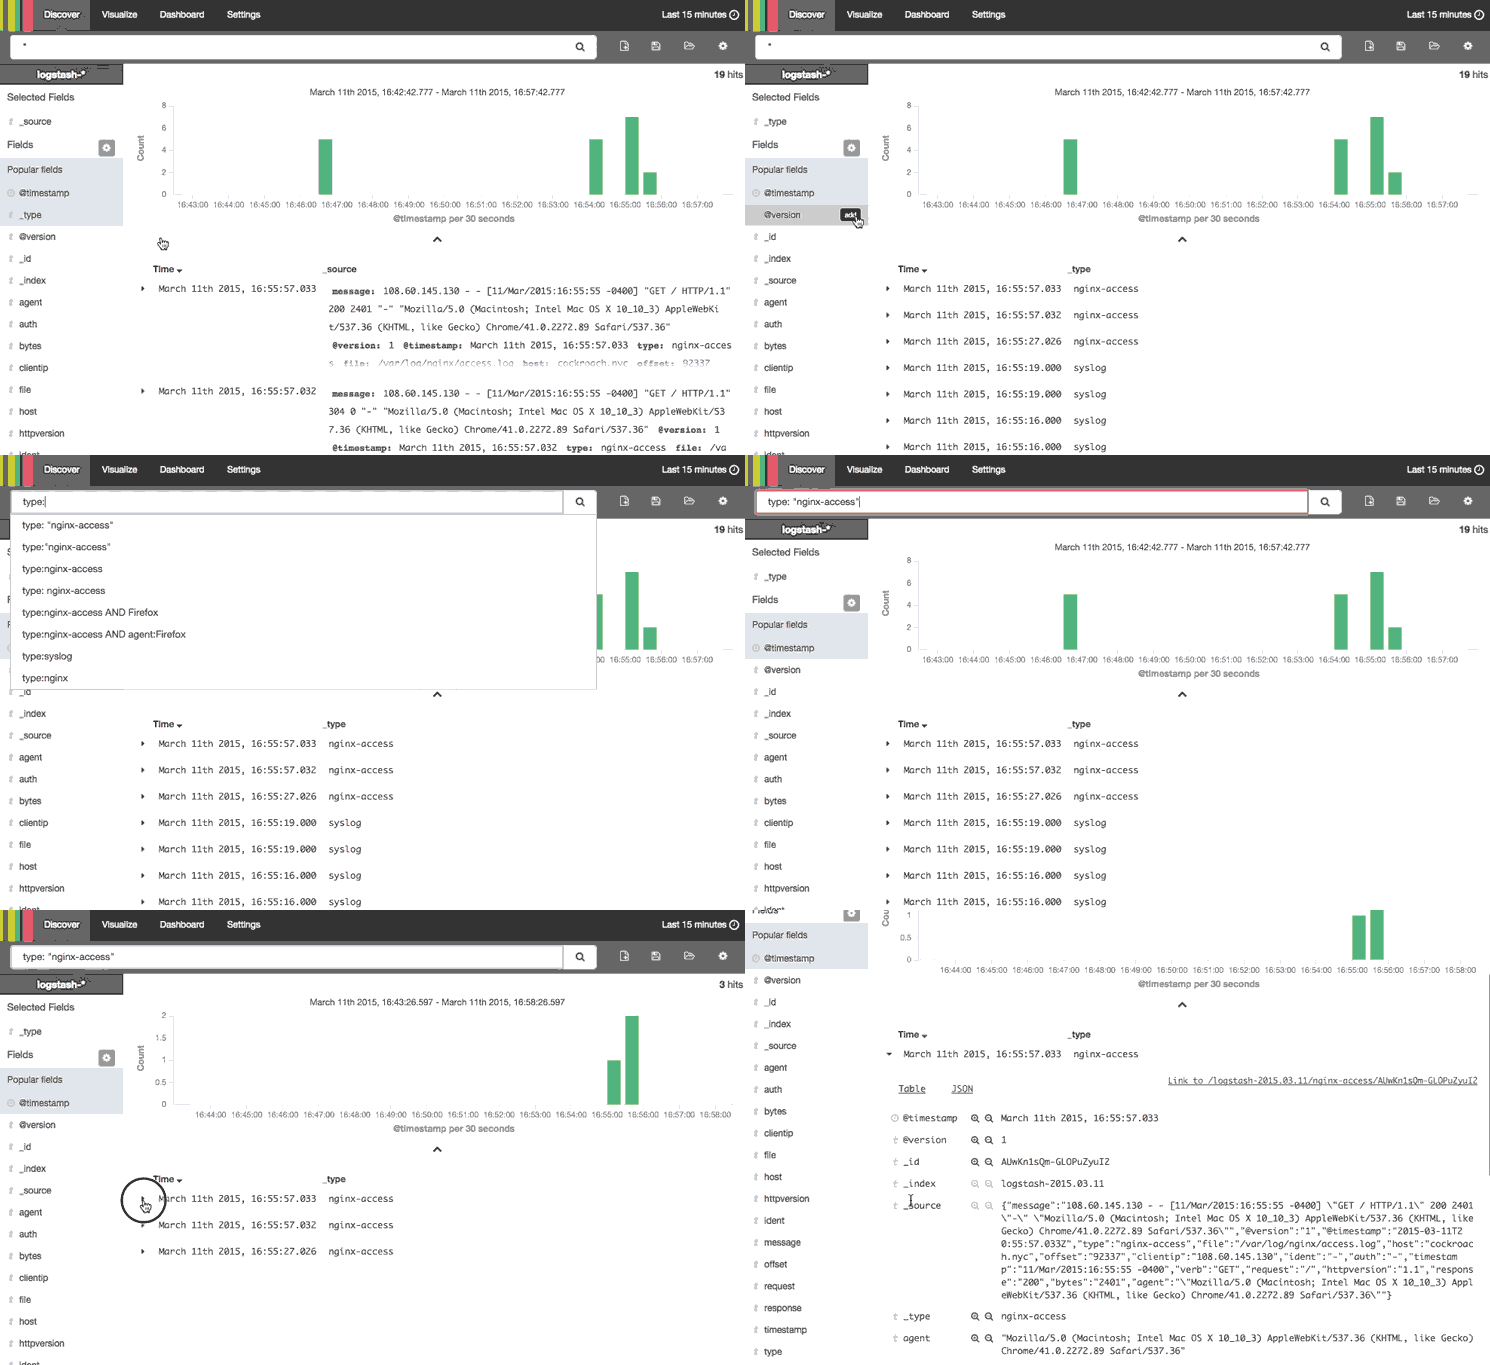
This animation demonstrates a few of the main features of the Discover page:
How To Use Kibana Discover
Here is a step-by-step description of what is being performed:
  1. Selected the "type" field, which limits what is displayed for each log record (bottom-right)—by default, the entire log message is displayed
  2. Searched for type: "nginx-access", which only matches Nginx access logs
  3. Expanded the most recent Nginx access log to look at it in more detail
Note that the results are being limited to the "Last 15 minutes". If you are not getting any results, be sure that there were logs, that match your search query, generated in the time period specified.
The log messages that are gathered and filtered are dependent on your Logstash and Logstash Forwarder configurations. In our example, we are gathering the syslog and Nginx access logs, and filtering them by "type". If you are gathering log messages but not filtering the data into distinct fields, querying against them will be more difficult as you will be unable to query specific fields.

Search Syntax

The search provides an easy and powerful way to select a specific subset of log messages. The search syntax is pretty self-explanatory, and allows boolean operators, wildcards, and field filtering. For example, if you want to find Nginx access logs that were generated by Google Chrome users, you can search fortype: "nginx-access" AND agent: "chrome". You could also search by specific hosts or client IP address ranges, or any other data that is contained in your logs.
When you have created a search query that you want to keep, you can do that by clicking the Save Searchicon then the Save button, like in this animation:
How To Save a Kibana Search
Saved searches can be opened at any time by clicking the Load Saved Search icon, and they can also be used when creating visualizations.
We will save the type: "nginx-access" search as "type nginx access", and use it to create a visualization.

Kibana Visualize

The Kibana Visualize page is where you can create, modify, and view your own custom visualizations. There are several different types of visualizations, ranging from Vertical bar and Pie charts to Tile maps(for displaying data on a map) and Data tables. Visualizations can also be shared with other users who have access to your Kibana instance.
If this is your first time using Kibana visualizations, you must reload your field list before proceeding. Instructions to do this are covered in the Reload Field Data subsection, under the Kibana Settings section.

Create Vertical Bar Chart

To create a visualization, first, click the Visualize menu item.
Decide which type of visualization you want, and select it. We will create a Vertical bar chart, which is a good starting point.
Now you must select a search source. You may either create a new search or use a saved search. We will go with the latter method, and select the type nginx access search that we created earlier.
At first, the preview graph, on the right side, will be a solid bar (assuming that your search found log messages) because it consists only of a Y-axis of "Count". That is, it is simply displaying the number of logs that were found with the specified search query.
To make the visualization more useful, let's add some new buckets to it.
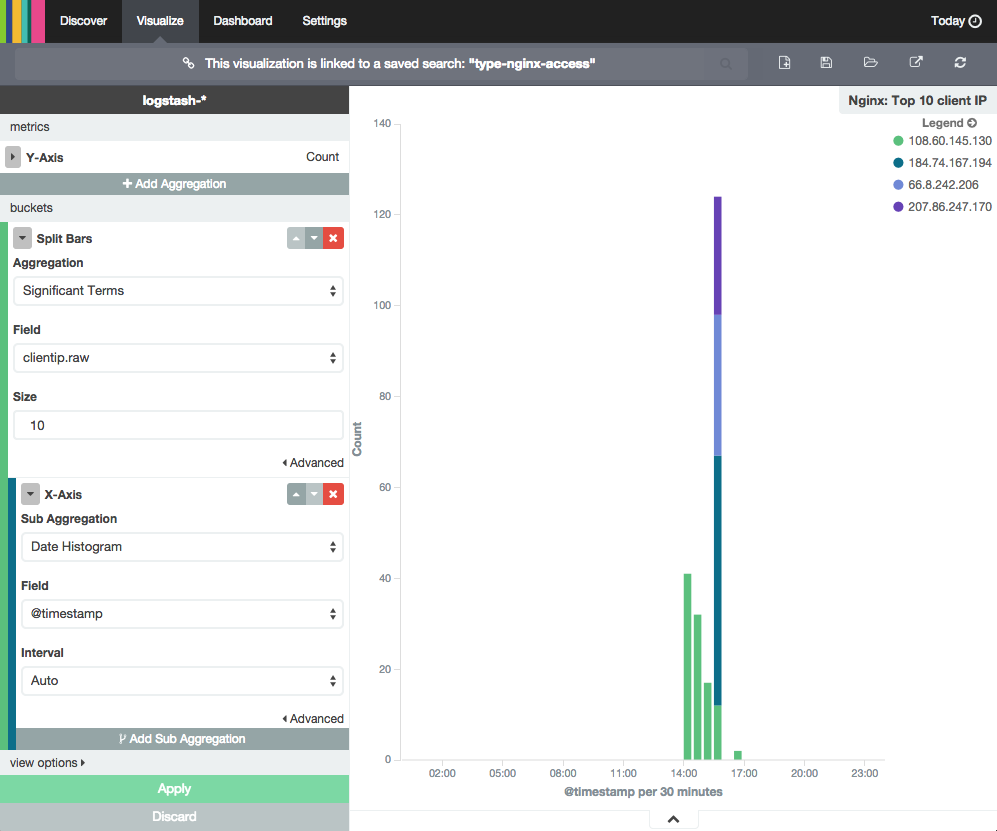
First, add an X-axis bucket, then click the Aggregation drop-down menu and select "Date Histogram". If you click the Apply button, the single bar will split into several bars along the X-axis. Now the Count is displayed as multiple bars, divided into intervals of time (which can be modified by selecting an interval from the drop-down)—similar to what you would see on the Discover page.
If we want to make the graph a little more interesting, we can click the Add Sub Aggregation button. Select the Split Bars bucket type. Click the Sub Aggregation drop-down menu and select "Significant Terms", then click the Field drop-down menu and select "clientip.raw", then click the Size field and enter "10". Click the Apply button to create the new graph.
Here is a screenshot of what you should see at this point:
Kibana Visualization Settings
If the logs being visualized were generated by multiple IP addresses (i.e. more than one person is accessing your site), you will see that each bar will be divided into colored segments. Each colored segment represents the Count of logs generated by a specific IP address (i.e. a particular visitor to your site), and the graph will show the up to 10 different segments (because of the Size setting). You can mouseover and click any of the items in the graph to drill down to specific log messages.
When you are ready to save your visualization, click the Save Visualization icon, near the top, then name it and click the Save button.

Create Another Visualization

Before continuing to the next section, where we will demonstrate how to create a dashboard, you should create at least one more visualization. Try and explore the various visualization types.
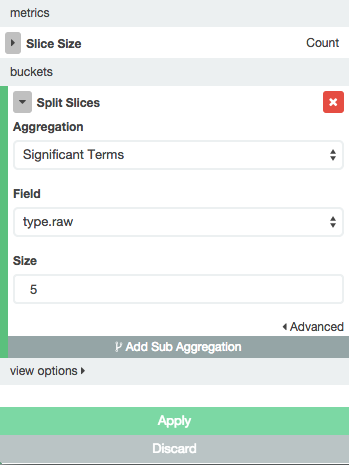
For example, you could create a pie chart of your top 5 (highest count) log "types". To do this, clickVisualize then select Pie chart. Then use a new search, and leave the search as "" (i.e. all of your logs). Then select *Split Slices** bucket. Click the Aggregation drop-down and select "Significant Terms", click the Field drop-down and select "type.raw", then click the Size field and enter "5". Now click the Applybutton and save the visualization as "Top 5".
Here is a screenshot of the settings that were just described:
Pie chart settings
Because, in our example, we're only collecting syslogs and Nginx access logs, there will only be two slices in the pie chart.
Once you are done creating visualizations, let's move on to creating a Kibana dashboard.

Kibana Dashboard

The Kibana Dashboard page is where you can create, modify, and view your own custom dashboards. With a dashboard, you can combine multiple visualizations onto a single page, then filter them by providing a search query or by selecting filters by clicking elements in the visualization. Dashboards are useful for when you want to get an overview of your logs, and make correlations among various visualizations and logs.

Create Dashboard

To create a Kibana dashboard, first, click the Dashboard menu item.
If you haven't created a dashboard before, you will see a mostly blank page that says "Ready to get started?". If you don't see this screen (i.e. there are already visualizations on the dashboard), press theNew Dashboard icon (to the right of the search bar) to get there.
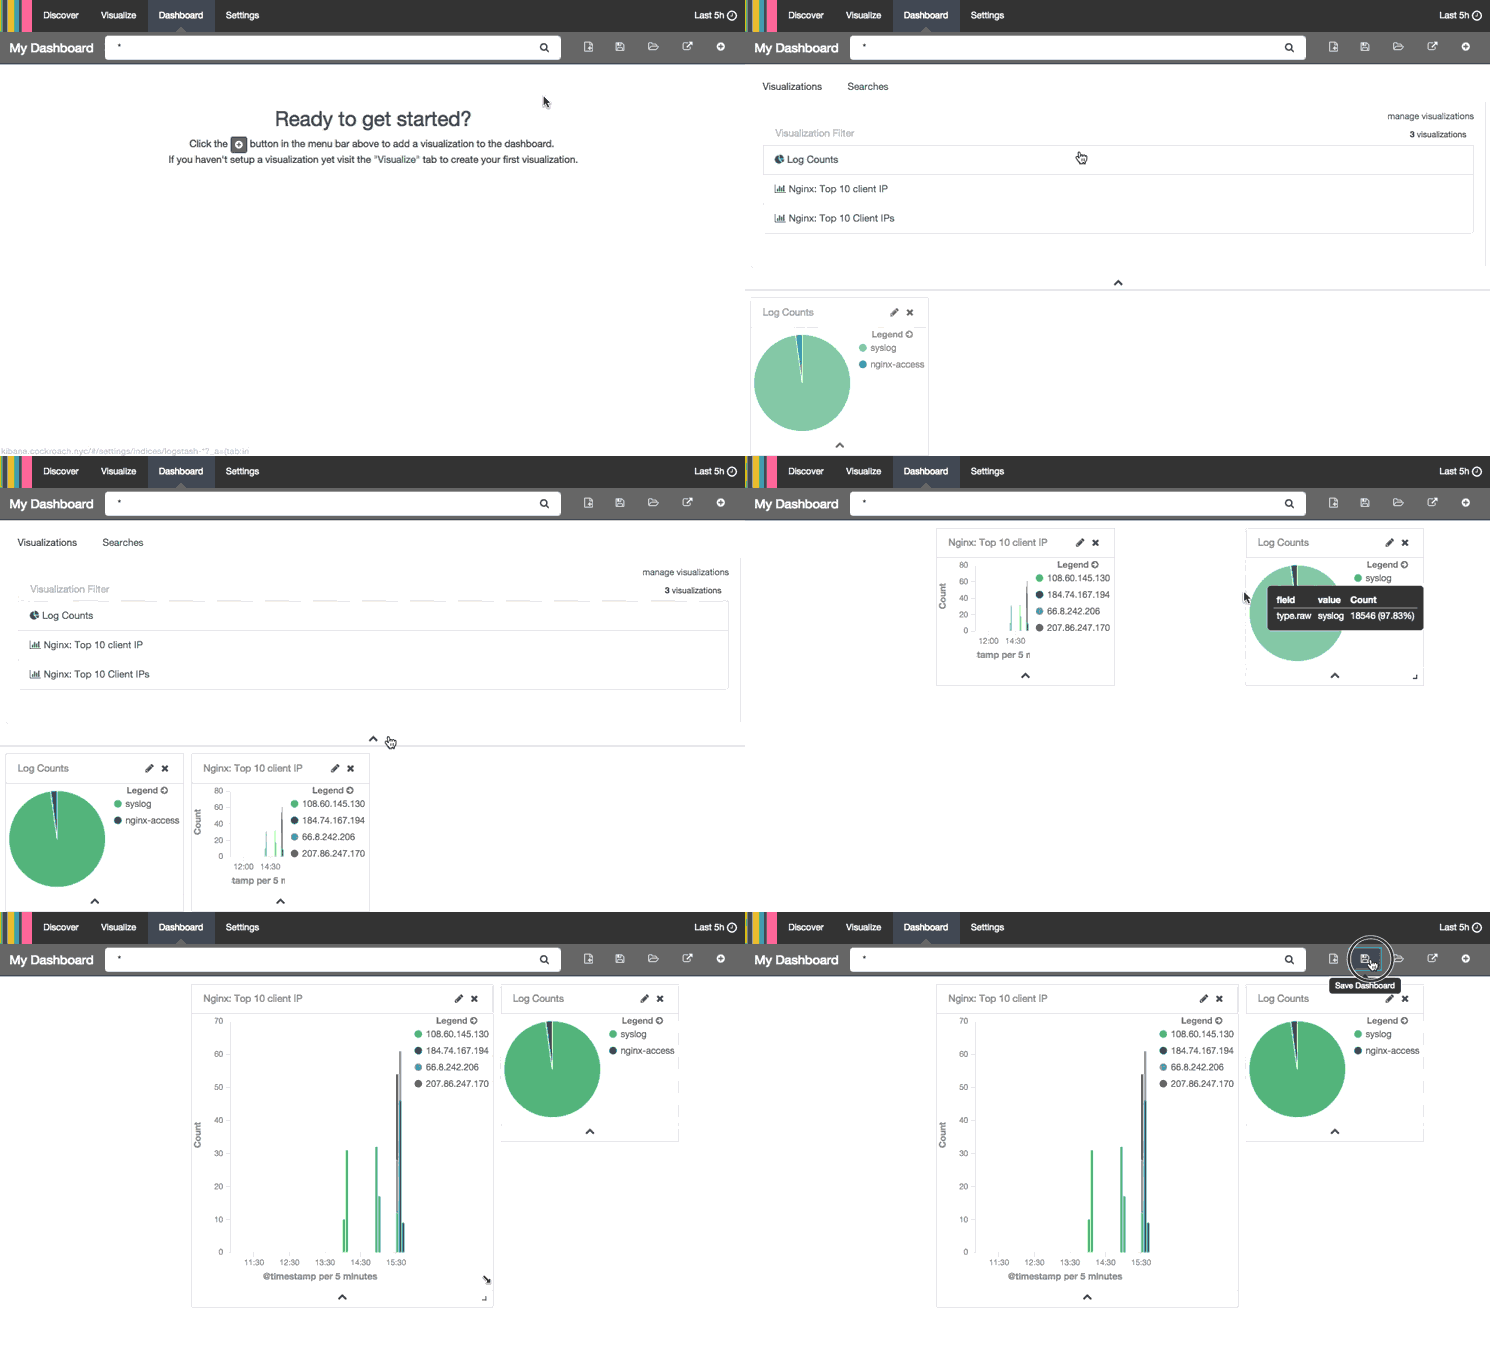
This animation demonstrates how to can add visualizations to your dashboard:
Create a Kibana Dashboard
Here is a breakdown of the steps that are being performed:
  1. Clicked Add Visualization icon
  2. Added "Log Counts" pie chart and "Nginx: Top 10 client IP" histogram
  3. Collapsed the Add Visualization menu
  4. Rearranged and resized the visualizations on the dashboard
  5. Clicked Save Dashboard icon
Choose a name for your dashboard before saving it.
This should give you a good idea of how to create a dashboard. Go ahead and create any dashboards that you think you might want. We'll cover using dashboards next.

Use Dashboard

Dashboards can be filtered further by entering a search query, changing the time filter, or clicking on the elements within the visualization.
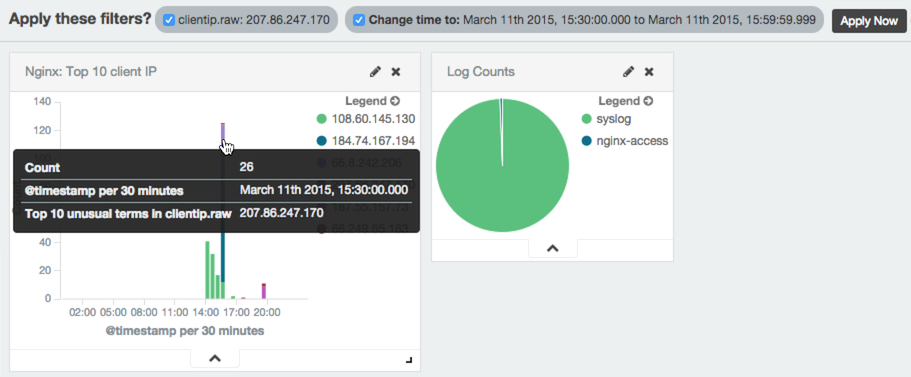
For example, if you click on a particular color segment in the histogram, Kibana will allow you to filter on the significant term that the segment represents. Here is an example screenshot of applying a filter to a dashboard:
Filter a dashboard
Be sure to click the Apply Now button to filter the results, and redraw the dashboard's visualizations. Filters can be applied and removed as needed.
The search and time filters work just like they do in the Discover page, except they are only applied to the data subsets that are presented in the dashboard.

Kibana Settings

The Kibana Settings page lets you change a variety of things like default values or index patterns. In this tutorial, we will keep it simple and focus on the Indices and Objects sections.

Reload Field Data

When you add new fields to your Logstash data, e.g. if you add a filter for a new log type, you may need to reload your field list. It is necessary to reload the field list if you are unable find filtered fields in Kibana, as this data is only cached periodically.
To do so, click the Settings menu item, then click "logstash-*" (under Index Patterns):
Reload Field List
Then click the yellow Reload Field List button. Hit the OK button to confirm.

Edit Saved Objects

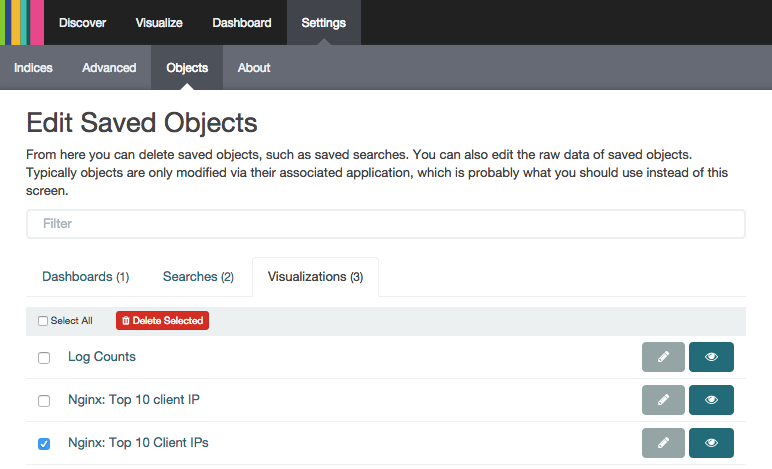
The Objects section allows you to edit, view, and delete any of your saved dashboards, searches, and visualizations.
To get there, click on the Settings menu item, then the Objects sub-menu.
Here, you can select from the tabs to find the objects that you want to edit, view, or delete:
Edit Saved Objects
In the screenshot, we have selected a duplicate visualization. It can be edited, viewed, or deleted by clicking on the appropriate button.

Conclusion

If you followed this tutorial, you should have a good understanding of how to use Kibana 4. You should know how to search your log messages, and create visualizations and dashboards.
Be sure to check out the next tutorial in this series, How To Map User Location with GeoIP and ELK
If you have any questions or suggestions, please leave a comment!